
Truck data analytics is the practice of turning telematics, weight, ELD, and TMS data into decisions you can actually act on — not just numbers you review at month-end. This blog covers where that data comes from, which metrics matter, how analytics improves day-to-day operations, and how to start implementing it without overhauling your entire tech stack.
Key Takeaways
- Integrating telematics, weight, ELD, and TMS data cuts operating costs and raises fleet efficiency
- Payload and axle-weight data prevents overweight fines and maximizes revenue per load
- Cost per mile, fuel efficiency, and on-time delivery rate should be tracked continuously, not just monthly
- Start small, prioritize data quality, then scale proven workflows across the fleet
What Is Truck Data Analytics and Why Does It Matter for Operations?
Truck data analytics means collecting and analyzing vehicle, driver, and load data to support decisions in the moment and over the long term. It pulls together streams such as:
- GPS pings and route history
- Axle and payload weights
- Driver and compliance records
- Invoicing and load documentation
The shift happening across fleets right now is from reactive to proactive. Month-end spreadsheets used to be the norm. Now, synchronized data systems let dispatchers and managers see problems as they emerge, not weeks later.
Freight volume will only add more pressure. The Bureau of Transportation Statistics forecasts US freight tonnage will grow 50% by 2050, reaching 28.7 billion tons, with trucks carrying most of it. More freight means more data, and fleets without a system to make sense of it will fall behind.
Fragmented data is the real barrier, not a shortage of sensors or feeds. FleetOwner documented a 90-truck fleet still manually entering utilization numbers because its safety, compliance, and CAN-bus systems didn't talk to each other.
Synchronizing telematics, TMS, and weight data (rather than collecting more of it) is what improves profitability, compliance, and safety at the same time.
Key Data Sources Powering Truck Operations Analytics
Every fleet analytics program draws from a handful of core sources:
- Telematics and GPS data — real-time location, speed, driver behavior, engine diagnostics
- ELD data — hours of service, vehicle movement, DVIRs for FMCSA compliance
- Onboard weight and payload data — axle-group, gross vehicle, and net weight monitoring
- Transportation Management Systems (TMS) — freight bookings, route planning, invoicing
- IoT and environmental sensors — cargo condition, weather, and traffic data for route adjustments

Weight Data: The Overlooked Source
Most fleets track telematics and ELD data closely. Weight data often gets left out, even though it directly affects both revenue and legal exposure.
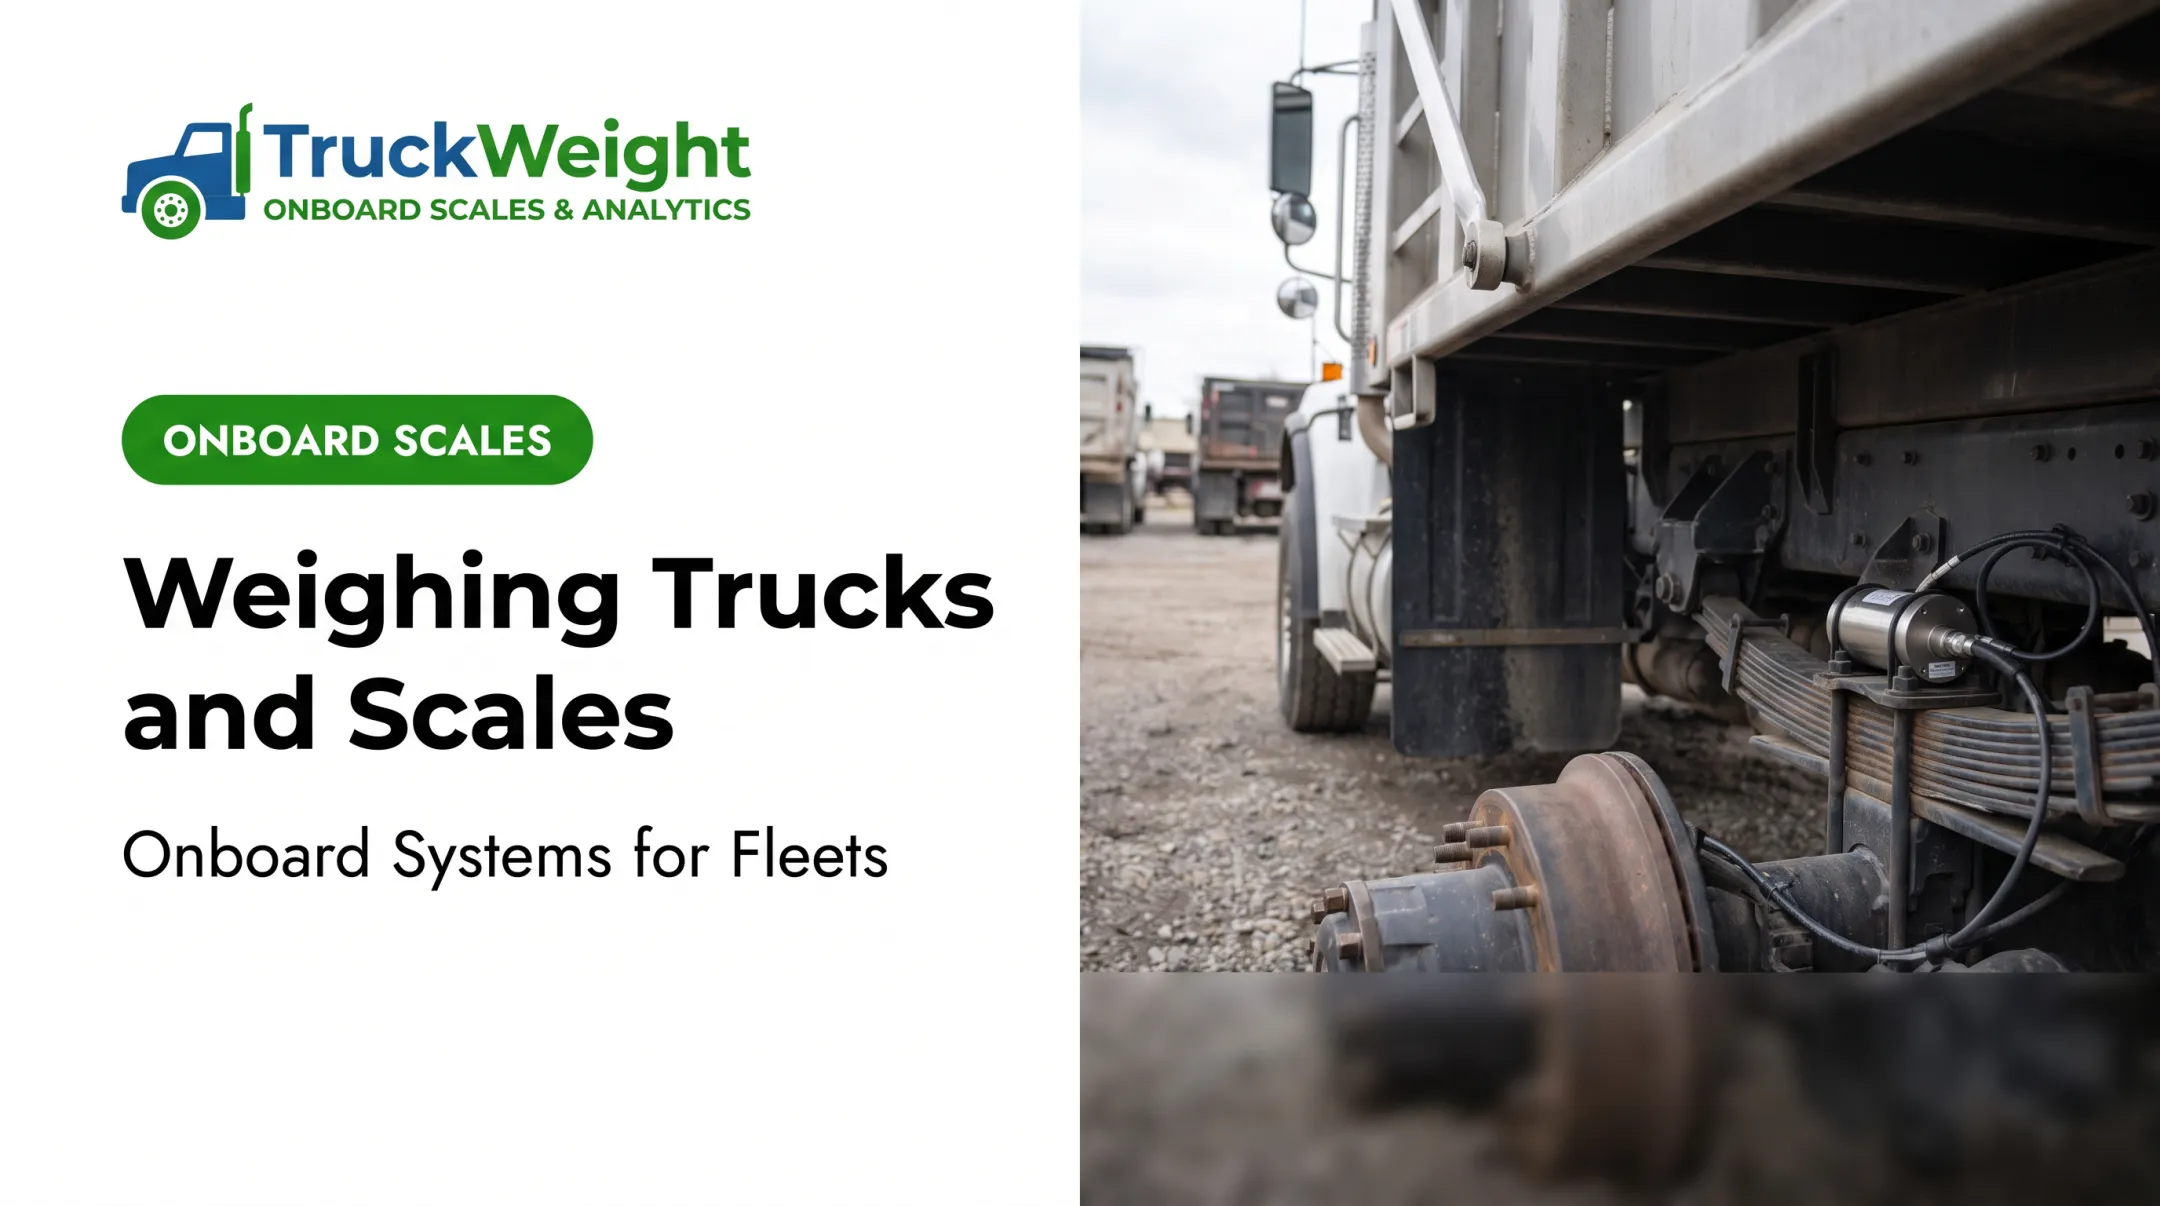
Wireless onboard scales, like TruckWeight's strain gauge and air suspension sensors, feed real-time axle and gross weight data into a fleet's broader analytics pipeline. TruckWeight's air suspension sensors are rated at 0.3% to 1% accuracy across weather conditions, while its SG-1/SG-2 strain gauges cover mechanical and spring suspensions at 0.3–2% accuracy.
Federal limits are strict: 20,000 lb for a single axle, 34,000 lb for tandem axles, and 80,000 lb gross vehicle weight under FHWA's bridge formula. State fines escalate quickly. Minnesota, for instance, charges graduated penalties from $0.01 per pound over up to $0.20 per pound over at higher thresholds.
Without real-time weight visibility, that compliance gap turns into real cost.
Essential Metrics and KPIs Fleets Should Track
Tracking the right KPIs continuously, not just at month-end, is what separates data-driven fleets from ones that just collect reports.
| Metric | What It Tells You |
|---|---|
| Cost per mile | Total costs ÷ total miles; the core profitability indicator |
| On-time delivery rate | Customer satisfaction and scheduling reliability |
| Fuel efficiency (MPG) | Route quality, driver behavior, engine health |
| Fleet/asset utilization | How much of your capacity is actually earning revenue |
| Maintenance cost per mile | Early warning sign for predictive maintenance needs |
| Payload / weight compliance | Overload risk, underloaded miles, and missed revenue per trip |

Cost per mile stays the anchor metric because it rolls up fuel, labor, maintenance, and overhead into one comparable number across your fleet. Utilization only holds up if trucks are actually moving. Idle trucks are a hidden cost sink. A parked truck still accrues fixed costs such as insurance, depreciation, and financing while earning nothing. Model it yourself: add daily fixed cost to the lost contribution margin from the missed load, and you get an idle-day figure specific to your operation. Maintenance cost per mile matters beyond budgeting. Trending it over time flags which trucks need attention before a breakdown, not after.
How Data Analytics Improves Operations and Efficiency
This is where the different data sources start working together.
Route Optimization
Real-time traffic and load data reduce out-of-route miles. An older ATRI simulation found routing a heavy vehicle onto Interstate roads instead of state highways improved fuel efficiency by 14% to 21%, mainly due to higher average speeds and fewer stops. The study is dated, but the underlying logic still holds: fewer stops and steadier speeds save fuel.
Predictive Maintenance
Historical vehicle data flags failures before they become breakdowns. Some fleets using predictive tools report preventing over a dozen tows per month by catching issues weeks in advance.
Payload Optimization and Compliance
This is where onboard weight data earns its place in the analytics stack. TruckWeight Analytics is a cloud-based system built on Google Cloud Platform, using Firestore, BigQuery, and PubSub to consolidate fleet weight data.
Here's what that means practically:
- Sensors capture weight in real time from strain gauges or air suspension sensors
- The Smart Data Pipeline pushes readings to the cloud instantly
- Firestore and PubSub distribute that data to connected devices and telematics APIs
- BigQuery stores it for back-office reporting, calibration checks, and compliance audits
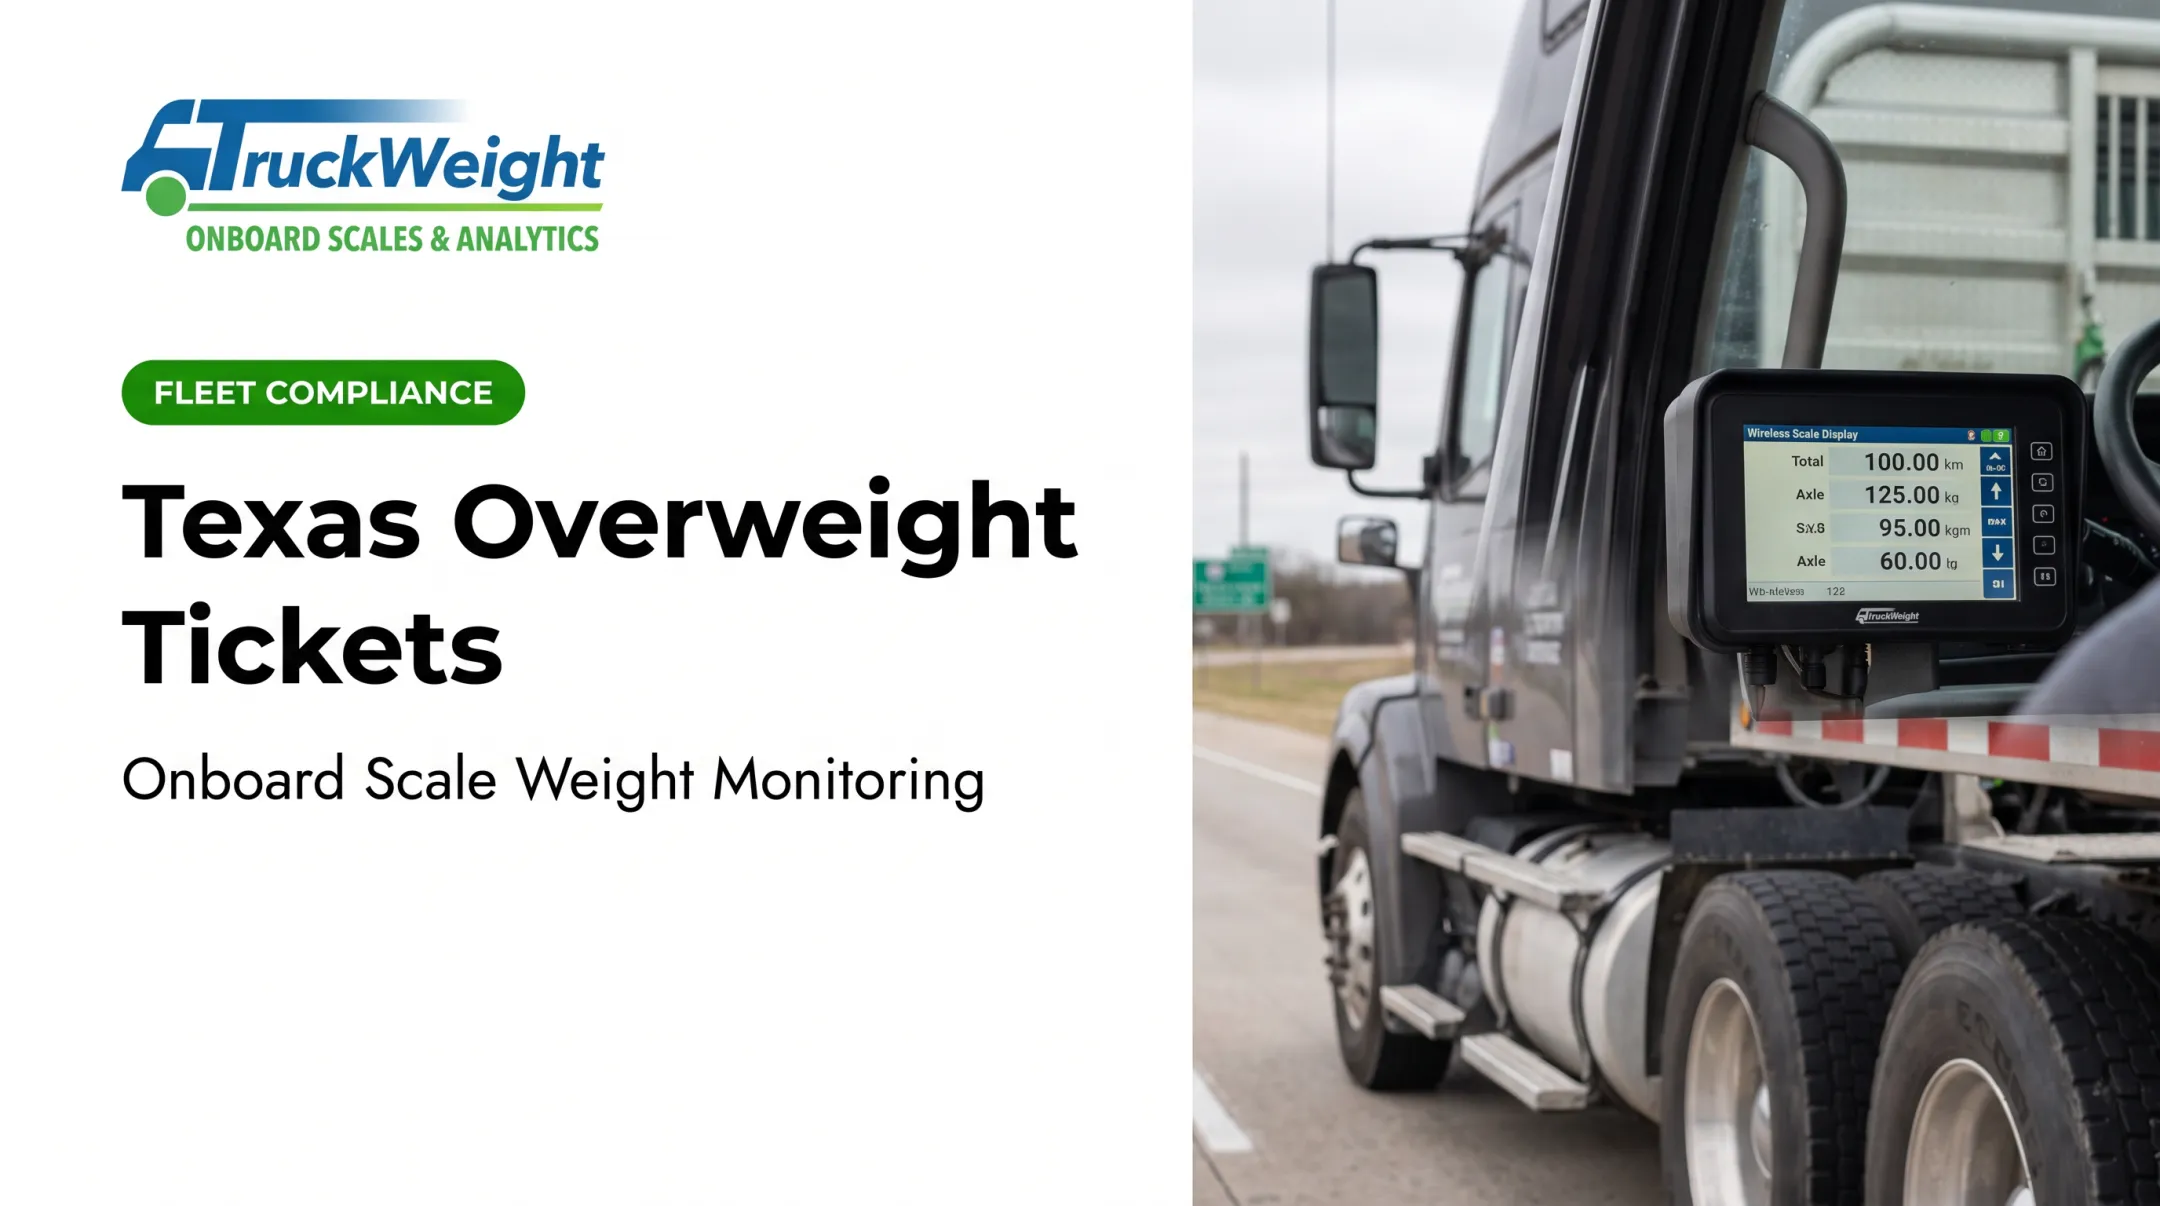
The result: drivers see live axle, gross, and net weights on an in-cab display, while back-office teams get centralized visibility without manual coordination.

Driver Performance and Risk Management
Telematics data flags harsh braking, excessive idling, and speeding. Those patterns tie directly to both safety and fuel economy. Combined with ELD and weight data, fleets can spot compliance gaps before they turn into violations or audit findings.
Getting Started: Implementing Data Analytics in Your Fleet
Don't try to instrument everything on day one. Start with clear goals.
- Identify specific operational goals: Is fuel cost, compliance risk, or payload efficiency your biggest pain point right now?
- Choose scalable technology that connects cleanly: Prioritize systems that sync telematics, TMS, and weight data over standalone point solutions
- Start small: Track a handful of key metrics first, train your team on them, then expand
Before you commit budget, keep these practical points in mind:
- Onboard scale systems like TruckWeight's are built for do-it-yourself installation, with no specialized installer or tools required for most units
- Remote calibration through TruckWeight Analytics lets back-office teams keep sensors accurate without a service visit
- OTA firmware updates and app-based monitoring keep support on the road, without pulling a truck in for service
Fleets that succeed with analytics review results on a set cadence and adjust the program as the data changes.
Frequently Asked Questions
What data should trucking companies track for analytics?
Track vehicle performance, driver behavior, delivery metrics, weight/payload data, and safety/compliance records. Together, these give a full operational picture rather than isolated snapshots.
How does data analytics reduce costs in trucking operations?
Route optimization cuts fuel spend, predictive maintenance reduces downtime and repair bills, and payload analytics prevents fines while maximizing revenue per load.
What challenges do fleets face when implementing data analytics?
Upfront technology costs, the need for staff who can interpret the data, and integrating systems that weren't built to talk to each other are the biggest hurdles.
Can data analytics help prevent overweight violations?
Yes. Onboard wireless scale data lets operators monitor axle-group and gross vehicle weights in real time, so loads stay compliant before they ever hit a scale.
How does data analytics improve fleet safety and compliance?
Combining ELD records, driver behavior data, and weight monitoring helps flag risks early, before they become violations, accidents, or audit findings.
What is the ROI of investing in truck data analytics tools?
Returns come from reduced fuel and maintenance costs, fewer overweight fines, and better asset utilization. Exact figures vary by fleet, but these are the measurable categories to track.